Moving up, down or sideways are the only three things markets can do.
Prices usually move as zigzags causing two conditions of the price movement:
With the help of the technical analysis, investors can determinate when to enter the market but more importantly when to exit to minimize the loss.

Actions of price are not absolutely random; however technical analysis rely on that the markets are inordinate (someone cannot know what is going to happen certainly). In other saying, the mathematical Chaos Theory proves that within a state of chaos there are identifiable patterns that tend to repeat.
It is like the weather forecast, nothing is certain. Successful trading is not about being right or wrong, it is about identifying probabilities and trading when the probabilities are in your favor. Identifying probabilities mostly includes the estimation of entering a position, but more importantly the determination of your risk and reward ratio.
There is no fortunetelling in technical analysis. Good risk management, discipline and controlling your emotions are the keys of a successful trading. Anyone can guess once in a while but for consistency in winning risk management is a muss.
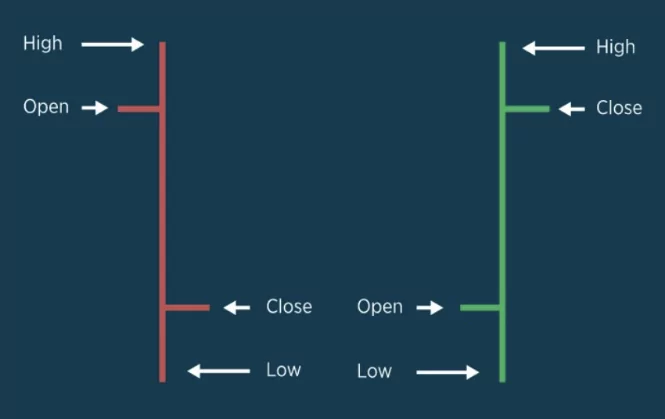
Bars and candlesticks are the most used charting types in order to represent the past prices. These two charts are very similar fort the information yet they look different.
These charts are parted into different periods of time, representing high and low opening and closing prices for a given period.
When you look at a daily graph, each chart presents that the trading activity of that day. If you look at the graph for 15 minutes, each chart presents a 15-minute activity.

Technical Analysis involves researching and mapping the trends and price patterns through several indicators or studies. The graphs that show the relationship between time and price help traders to monitor and read more data, moreover it procures areas of indecision or reversal of sentiment. (More information will be held in Understanding Candlesticks section) Hereby, in order to identify enter and exit probabilities to develop a strategy, technical analysis is used.
The candlesticks of downtrends (bears) are usually red and mean in a time period, closing price is less than opening price. The uptrends (bulls) are usually green and has the opposite meaning of the downtrends candlesticks, the opening is lower than closing.
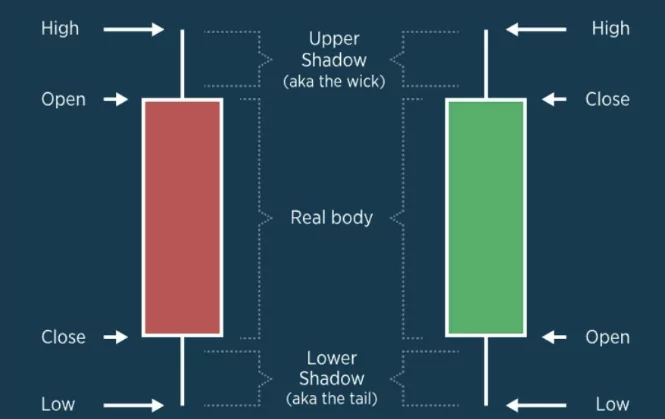
As we have seen in the candlesticks, the bears are red, the bulls are green and all interpretations are the same.